Referring to the name of TradingView, surely all Vietnamese Trader brothers are known. It has been so popular and familiar with the Trader community around the world for a long time. TradingView is the best, most powerful and easiest to use charting service. The plus point is, you can share ideas and learn from others in real time. This article will guide you to use TradingView in a methodical and detailed way from A to Z (illustrated by animation) along with some tips that have never been revealed.
What is TradingView?
TradingView.com is a social network for traders and investors on the Stock market, Futures and Forex market, to analyze, identify and share trading ideas. The charts on TradingView are very intuitive and easy to use for newbies but also powerful enough to meet the needs of experienced traders.
Real-time data and browser-based charts allow you to research from anywhere, since there are no complicated settings or settings. Just visit TradingView.com in any browser or download the TradingView App to your phone and you can start drawing charts, learning and sharing trading ideas!
Founded in September 2011, up to now, 6 million investors and traders around the world are using TradingView on a regular basis with over 4 million published trading ideas.
Technical analysis with TradingView
TradingView has over 100 indices and more than 50 smart drawing tools covering most popular trading concepts. The exclusive Pine Script language allows you to change existing indexes or create anything from scratch. There are 1000 scripts published by other traders in the public script library.
Learn and share business ideas with the community
You can learn about trading and investing by keeping track of how others are trading. Visit the ideas section and click Play to see how historical forecasts actually took place.
If you are an experienced investor, you can publish ideas to your TradingView profile, introducing your talents to the community.

TradingView account packages
TradingView currently offers 4 types of accounts to users, including the following:
- Basic account (free)
- Pro account
- Pro + account
- Premium account

With each higher fee account type, you will experience and use the more advanced features of TradingView. If the referral is successful, both you and the referrer will be awarded $ 30 to your account.
Detailed TradingView user guide (by animation)
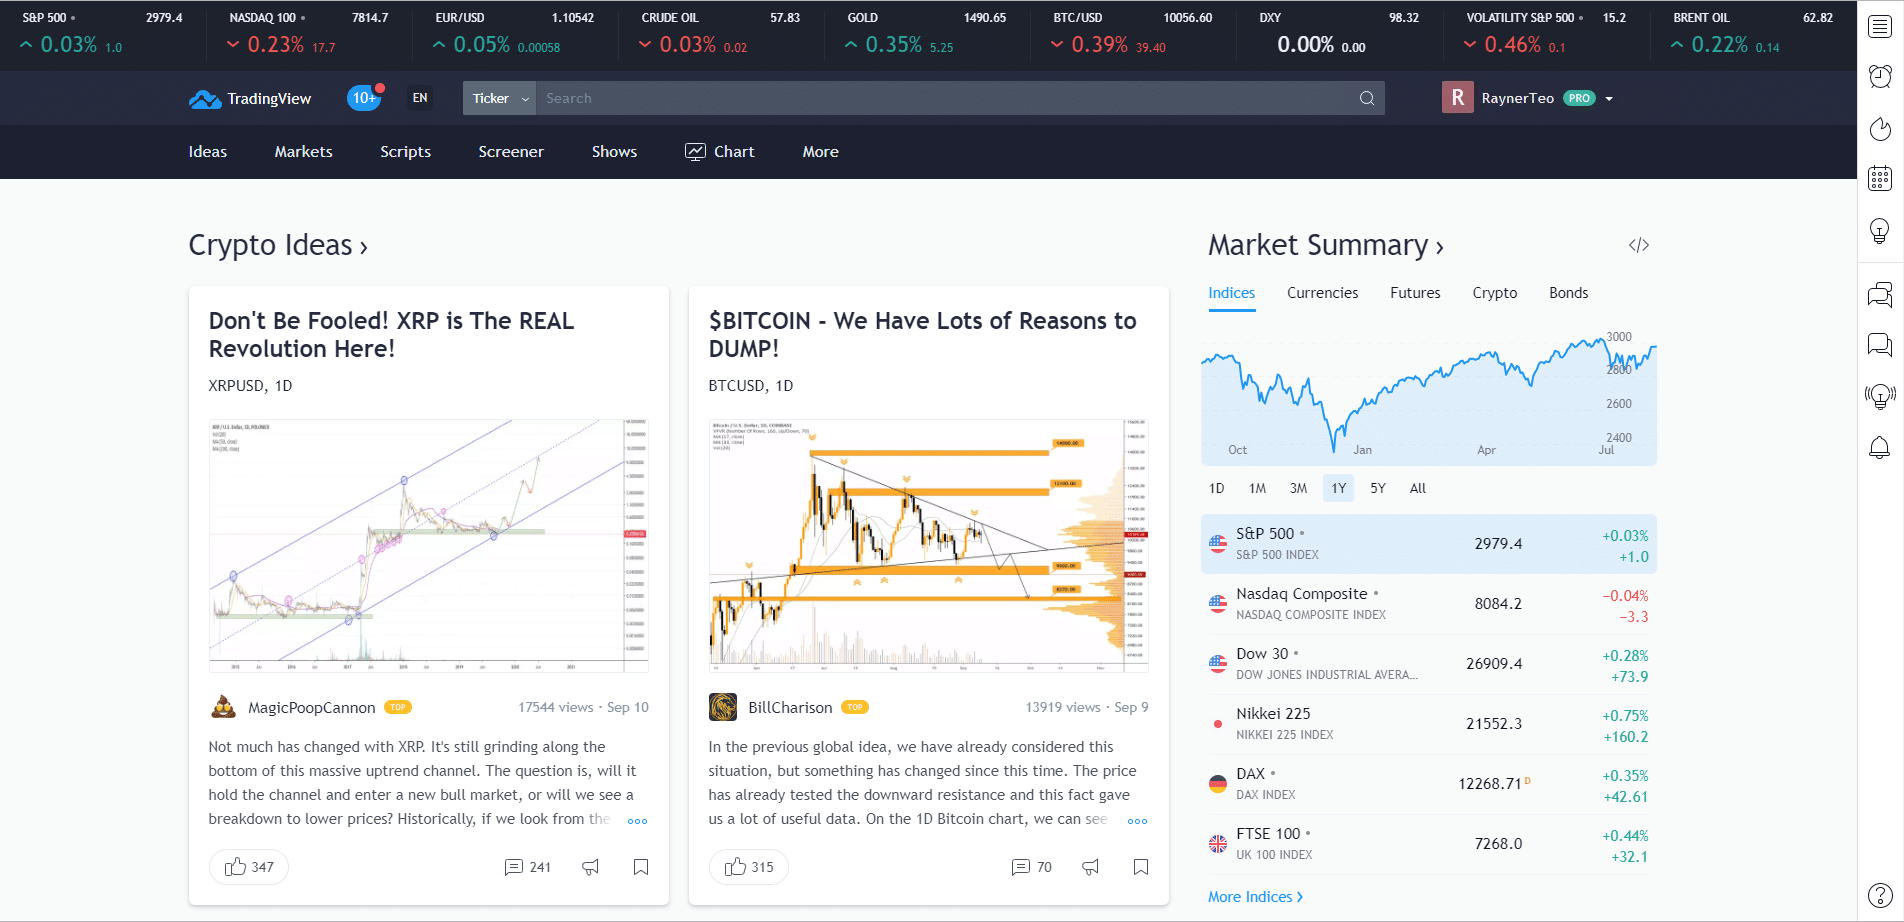
When you visit TradingView.com, the homepage will appear like this:

Click the "Chart" button to open the chart page.

1. How to set up and customize Tradingview charts
Now in their default settings. So how do you customize the charts for a template you like? You will right click and go to Settings.

You should see the settings panel appear like this.

Symbol tab
For the Symbol tab, it's all about changing the symbol colors and values, etc. If you are not sure what it is about, simply uncheck and check the box. This way, you will know the changes made to the TradingView chart.

Status line tab
Tick to display the code, OHLC value, bar change values, indicator title ...

Appearance tab
Customize background color, grid color and style, font size, top and bottom margins, right margins ...

Trading tab
If you have connected your broker to this platform, you can use this tab. Again, check and uncheck the boxes to see which parts are mentioned.
There are many other sections, but I just mentioned the most common customizations that Trader often uses.
2. Set up drawing tools
This is where your drawing tools are located, you will use them very often to analyze price charts.

The first is to customize the mouse cursor mode.

This second symbol is where you can start drawing: trend lines, price channels, arrows, etc.

All these tools can be customized, just double click on the lines you have drawn.

Next, you can draw Fibonacci levels and patterns like Pitchfork, Gann, etc.

For example, draw the Fibonacci retracement level as follows:

Then you have Cypher, ABCD, Elliot Waves, head and shoulders, triangle models, etc.

With the next tool, you can determine your Risk - Reward ratio.

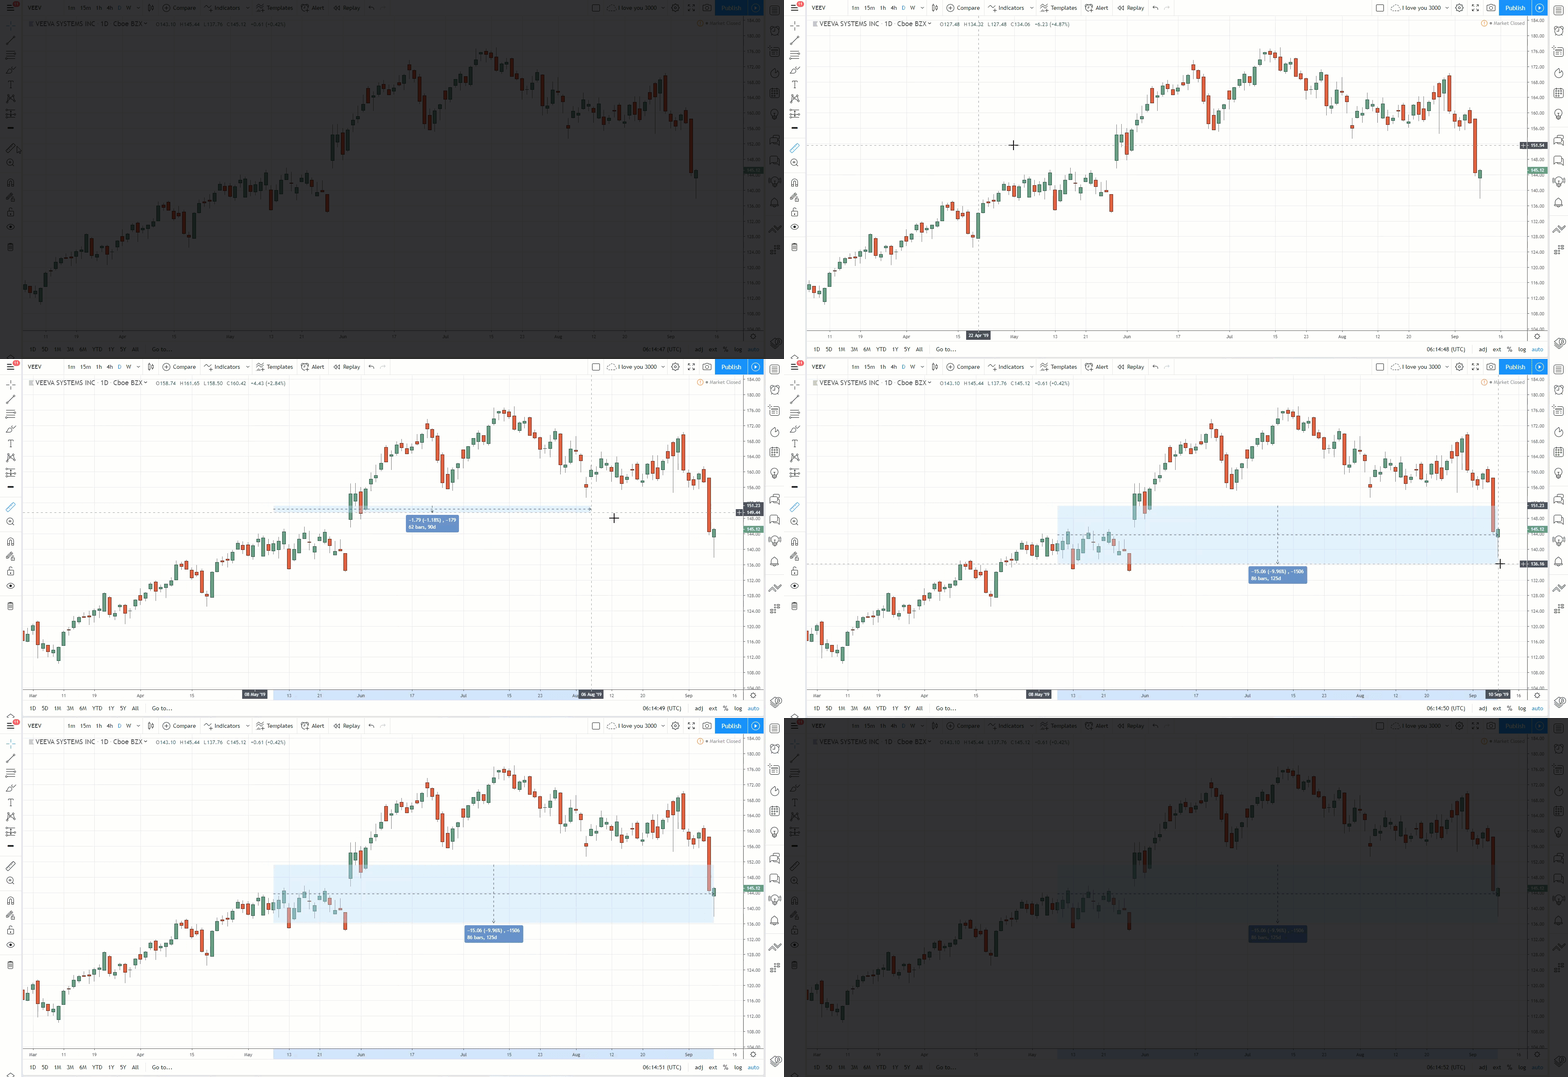
The next noteworthy tool is the Measurement tool, which measures the number of bars on your chart. In the example, dragging from left to right, it shows that there are 86 bars that last longer than 125 days.

If you want to delete all drawing tools, click the trash icon.

3. How to insert indicators on TradingView
Click the "Indicators" button to start adding indicators.

A list of indicators and strategies appears.

In addition to the common popular indicators like in the MT4 software, there is also a Community Library where others have created their own indicators and uploaded them for everyone to use. It has ranked the most popular metrics based on the number of likes.
For example I want to add the moving average to the chart:


If you want to customize the indicators, just double click on the indicator and then a settings box will appear.

4. Create watchlists on TradingView
How do you create a list of currency pairs or indicators you want to track? Every time you enter and don't have to re-enter characters like USD / JPY, EUR / USD, etc. What you can do is click the list tab, find and add currency pairs as follows:

5. Navigate the quick time frame on TradingView
The trading time frame is at the top left of the chart. You want to change the time frame quickly instead of clicking on the drop-down arrow, do the following: select the time frame you want and tick the favorite icon.

Summary: Trading and investing forex or any other market has a great risk of losing money. Therefore, you need to find out carefully before trading real money. Start learning and practicing with TradingView until you are confident to make a profit.


Post a Comment
Post a Comment