Gold Trading/ Gold / XAUUSD includes ounces of gold (XAU) and US dollars (USD). It should be noted that one lot for XAUUSD is 100 ounces of gold. Gold, along with other precious metals, is considered a safe haven, meaning it attracts special attention of investors during a period of decline in political or economic stability. gender (or region). The pair is highly liquid and popular with investors, being able to trade using both types of analysis (technical and fundamental). The significant increase in the volatility of XAUUSD is greatly influenced by such fundamental factors as monetary policy changes in the US, Japan, Eurozone and the UK, the official statements of bank governors. and publish records from Central Bank meetings such as GDP and inflation data in listed countries. The growth of US macroeconomic data led to the corresponding increase of the country's national currency, including the XAUUSD pair.

In this article, I will share some tips that can help you trade gold (XAUUSD) more effectively.
1. Use RSI and Fibonacci tools when analyzing Gold price techniques
RSI (Relative Strength Index) and Fibonacci are very effective tools in gold price technical analysis. Fibonacci can help you find important resistance and support levels, and RSI will assist you in identifying the trend and overbought / oversold points of the price of Gold.

When using the RSI indicator, make sure to adjust the parameters to suit your trading tactics. For example, if you are a long-term trader, consider increasing the time setting instead of using the default 14 days. The higher the setup time, the more smooth the RSI will be and give more accurate long-term trading signals.
Besides, don't forget to backtest to find the best settings and overbought / oversold levels for your RSI indicator. If you see the price of Gold bounced back many times when the RSI reaches the 35 level, don't be afraid to add this threshold to your watchlist.
2. Use the trendline lines and channels to determine the trend of the Gold price
Moving averages are an extremely effective trend technical indicator in forex trading. However, for gold trading, this indicator has proven to be less effective than hand-drawn trend lines and channels.

Therefore, you should consider using manual drawing tools when trading gold. They not only help you identify effective gold price trends, but also help identify extremely accurate support and resistance areas.
3. Perform multi-time analysis of the time frame
Gold is a highly volatile asset. Therefore, if you do not have a broad view of the gold price movement, you will be very susceptible to bull traps or bear traps.
If you regularly trade Gold on short-term charts (1 hour or less), use the medium and long-term charts (4 hours, 1 day, or 1 week) to determine the overall trend and key resistance / support levels of Gold price. The larger the time frame, the more reliable the levels of support and resistance.
Conversely, if you often trade on long-term charts, use short-term charts to optimize your entry points, stop loss and take profit.
4. Keep an eye on important US economic reports and USD developments
On the market, Gold and USD often have a negative correlation. That means, gold usually increases when the USD goes down, and vice versa. Therefore, closely monitoring important US economic reports and USD movements will help you predict Gold's trend better.

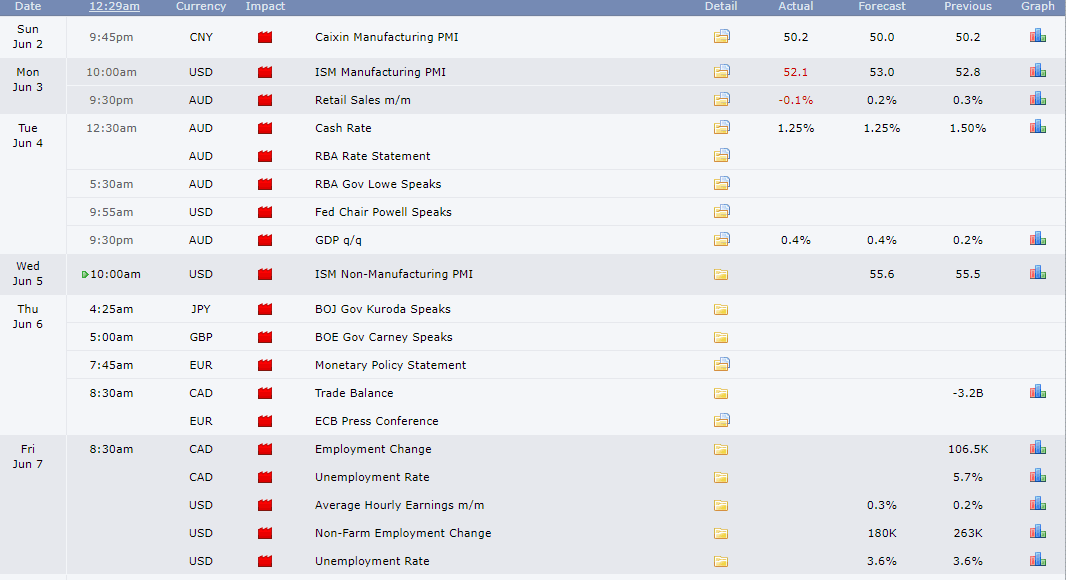
Here are some important data you need to track on the economic calendar:
- Consumer price index (CPI)
- GDP
- Non-farm Payrolls
- Employment Change and Unemployment Rate (Employment Change and Unemployment Rate)
- Purchasing Management Index (PMI)
- Retail Sales
In addition, you also need to keep track of the happenings and interest rate decisions of the US Federal Reserve (Fed). The move to raise interest rates by this agency is likely to cause the dollar to appreciate; Conversely, the dollar may depreciate when the Fed declares interest rates.


Post a Comment
Post a Comment